OmniAccess Stellar: AP Status Monitor – Keeping an Eye on Access Points via SSH
Anyone who manages OmniAccess Stellar access points knows the situation: a client has problems, and you want to find out quickly which AP it is connected to, how good its signal is and at what data rate it is connected. Especially in environments without OmniVista, or when troubleshooting on site, this often means logging in to several APs one after the other via SSH and running commands. That is exactly why I wrote the AP Status Monitor.
What the Tool Does
The AP Status Monitor is a small desktop application for Windows. You enter an IP range or a list of IP addresses, store the SSH credentials and start the scan. The tool connects to all APs in parallel, runs a fixed set of show and diagnostic commands and presents the results per AP in tabs:
- System – model, firmware, uptime, memory
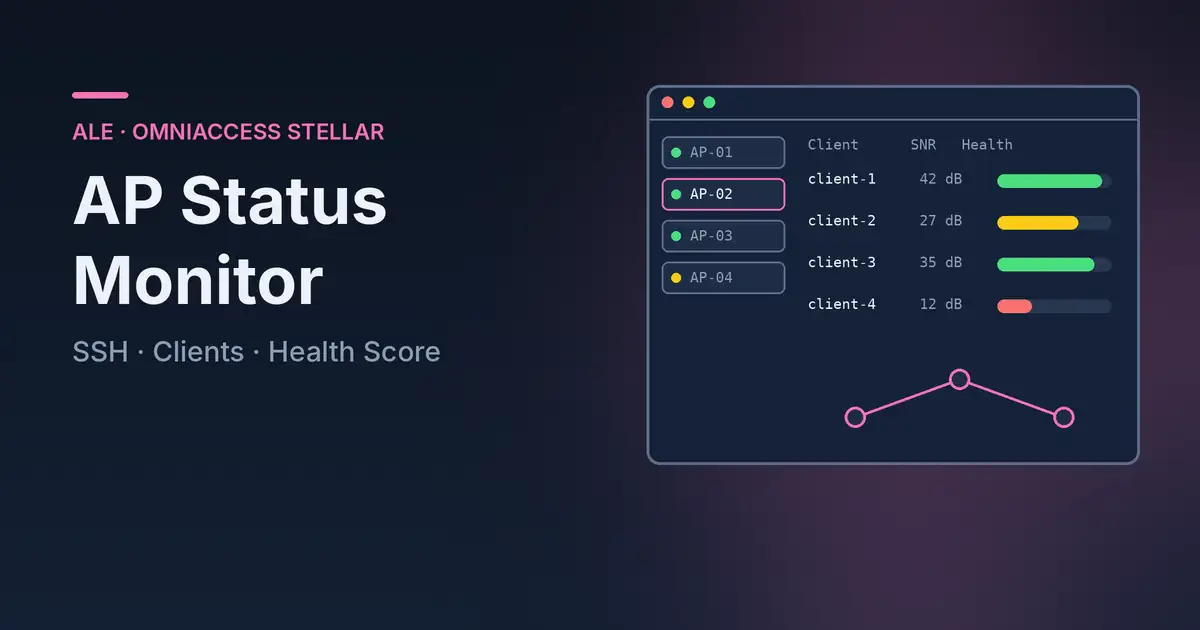
- Client list – connected clients with hostname resolution, band, data rates and health score
- Wireless – interfaces, channel, transmit power
- Network – WAN IP, routes, DNS
- Mesh – neighbor table for mesh links
- Topology – graphical overview of the APs, including location where configured
With auto-refresh, the view updates regularly. The tool distinguishes between static data such as name, model and firmware, which is cached for ten minutes, and dynamic data such as clients, mesh and traffic, which is queried on every cycle. This keeps the load on the APs low.
The Health Score
For me, the most useful feature is the health score in the client list. For each client, the tool calculates a value between 0 and 100 based on four factors:
| Factor | Max. points |
|---|---|
| SNR (signal-to-noise ratio) | 50 |
| TX rate | 20 |
| Band (5 GHz preferred) | 15 |
| RX rate | 15 |
A client with 80 points or more is considered “Healthy”, from 50 “Warning”, and below that “Critical”. More important than the number itself is the breakdown: you immediately see whether a client scores poorly because of a weak signal, a low data rate or because it is stuck on the 2.4 GHz band. That speeds up troubleshooting considerably.
One Stellar specific: the column labelled RSSI in the AP output actually contains the SNR in dB, not a level in dBm. The tool takes this into account in its rating.
Further Features
- Profiles per site – settings are stored in INI files, so you can switch quickly between customers or sites
- SSH debug log – every command and response can be logged in case an output is not parsed as expected
- Right-click copy – single cells, rows or the whole table as TSV, handy for tickets and documentation
- Dark and light theme
Installation
The tool is written in Python and requires Python 3.8 or later plus paramiko for the SSH connections. Optionally, dnspython resolves the client hostnames.
pip install paramiko
pip install dnspython   # optional
If you do not want a Python environment on your machine, you can build a standalone EXE with PyInstaller. The INI files are then stored in the same directory as the EXE.
I tested the tool with the OAW-AP1201, OAW-AP1221 and OAW-AP1431 models running AWOS 5.0.4.
A Note on Security
The SSH credentials are only obfuscated in the INI files, not encrypted. I therefore recommend not sharing these files and only using the tool on trusted machines.
Conclusion
The AP Status Monitor does not replace a management system like OmniVista, but it is a quick everyday tool: scan once, select an AP, and you can see at a glance how the clients are doing. Especially for on-site troubleshooting or in smaller installations with Stellar Express clusters, it saves a lot of typing.
The tool is available on GitHub under the MIT license: github.com/dgawin/ale-ap-monitor.
Note: This is a personal project and is not affiliated with Alcatel-Lucent Enterprise or my employer SPIE. Use at your own risk.